Introduction
In any complex system, a large part of the performance optimization process is the untangling of the interactions between the many distinct and separate layers of the system, each with its own set of constraints and limitations. So far, we have examined a number of individual networking components in close detail—different physical delivery methods and transport protocols—and now we can turn our attention to the larger, end-to-end picture of web performance optimization:
-
Impact of latency and bandwidth on web performance
-
Transport protocol (TCP) constraints imposed on HTTP
-
Features and shortcomings of the HTTP protocol itself
-
Web application trends and performance requirements
-
Browser constraints and optimizations
Optimizing the interaction among all the different layers is not unlike solving a family of equations, each dependent on the others, but nonetheless yielding many possible solutions. There is no one fixed set of recommendations or best practices, and the individual components continue to evolve: browsers are getting faster, user connectivity profiles change, and web applications continue to grow in their scope, ambition, and complexity.
Hence, before we dive into enumerating and analyzing individual performance best practices, it is important to step back and define what the problem really is: what a modern web application is, what tools we have at our disposal, how we measure web-performance, and which parts of the system are helping and hindering our progress.
§Hypertext, Web Pages, and Web Applications
The evolution of the Web over the course of the last few decades has given us at least three different classes of experience: the hypertext document, rich media web page, and interactive web application. Admittedly, the line between the latter two may at times be blurry to the user, but from a performance point of view, each requires a very different approach to our conversation, metrics, and the definition of performance.
- Hypertext document
-
Hypertext documents were the genesis of the World Wide Web, the plain text version with some basic formatting and support for hyperlinks. This may not sound exciting by modern standards, but it proved the premise, vision, and the great utility of the World Wide Web.
- Web page
-
The HTML working group and the early browser vendors extended the definition of hypertext to support additional hypermedia resources, such as images and audio, and added many other primitives for richer layouts. The era of the web page has arrived, allowing us to produce rich visual layouts with various media types: visually beautiful but mostly non-interactive, not unlike a printed page.
- Web application
-
Addition of JavaScript and later revolutions of Dynamic HTML (DHTML) and AJAX shook things up once more and transformed the simple web page into an interactive web application, which allowed it to respond to the user directly within the browser. This paved the way for the first full-fledged browser applications, such as Outlook Web Access (originator of XMLHTTP support in IE5), ushering in a new era of complex dependency graphs of scripts, stylesheets, and markup.
An HTTP 0.9 session consisted of a single document request, which was perfectly sufficient for delivery of hypertext: single document, one TCP connection, followed by connection close. Consequently, tuning for performance was as simple as optimizing for a single HTTP request over a short-lived TCP connection.
The advent of the web page changed the formula from delivery of a single document to the document plus its dependent resources. Consequently, HTTP/1.0 introduced the notion of HTTP metadata (headers), and HTTP/1.1 enhanced it with a variety of performance-oriented primitives, such as well-defined caching, keepalive, and more. Hence, multiple TCP connections are now potentially at play, and the key performance metric has shifted from document load time to page load time, which is commonly abbreviated as PLT.
The simplest definition of PLT is "the time until the loading spinner stops spinning in the browser." A more technical definition is time to onload event in the browser, which is an event fired by the browser once the document and all of its dependent resources (JavaScript, images, etc.) have finished loading.
Finally, the web application transformed the simple web page, which used media as an enhancement to the primary content in the markup, into a complex dependency graph: markup defines the basic structure, stylesheets define the layout, and scripts build up the resulting interactive application and respond to user input, potentially modifying both styles and markup in the process.
Consequently, page load time, which has been the de facto metric of the web performance world, is also an increasingly insufficient performance benchmark: we are no longer building pages, we are building dynamic and interactive web applications. Instead of, or in addition to, measuring the time to load each and every resource (PLT), we are now interested in answering application-specific questions:
-
What are the milestones in the loading progress of the application?
-
What are the times to first interaction by the user?
-
What are the interactions the user should engage in?
-
What are the engagement and conversion rates for each user?
The success of your performance and optimization strategy is directly correlated to your ability to define and iterate on application-specific benchmarks and criteria. Nothing beats application-specific knowledge and measurements, especially when linked to bottom-line goals and metrics of your business.
§Anatomy of a Modern Web Application
What does a modern web application look like after all? HTTP Archive can help us answer this question. The project tracks how the Web is built by periodically crawling the most popular sites (300,000+ from Alexa Top 1M) and recording and aggregating analytics on the number of used resources, content types, headers, and other metadata for each individual destination.
An average web application, as of early 2013, is composed of the following:
-
90 requests, fetched from 15 hosts, with 1,311 KB total transfer size
-
HTML: 10 requests, 52 KB
-
Images: 55 requests, 812 KB
-
JavaScript: 15 requests, 216 KB
-
CSS: 5 requests, 36 KB
-
Other: 5 requests, 195 KB
-
By the time you read this, the preceding numbers have already changed
and have grown even larger (Figure 10-2); the upward climb has been a stable
and reliable trend with no signs of stopping. However, exact request and
kilobyte count aside, it is the order of magnitude of these individual
components that warrants some careful contemplation: an average web
application is now well over 1 MB in size and is composed of roughly 100
sub-resources delivered from over 15 different hosts!

Unlike their desktop counterparts, web applications do not require a
separate installation process: type in the URL, hit Enter, and we are up
and running! However, desktop applications pay the installation cost just
once, whereas web applications are running the "installation process" on
each and every visit—resource downloads, DOM and CSSOM construction, and
JavaScript execution. No wonder web performance is such a fast-growing
field and a hot topic of discussion! Hundreds of resources, megabytes of
data, dozens of different hosts, all of which must come together in
hundreds of milliseconds to facilitate the desired instant web
experience.
Speed and performance are relative terms. Each application dictates
its own set of requirements based on business criteria, context, user
expectations, and the complexity of the task that must be performed.
Having said that, if the application must react and respond to a user,
then we must plan and design for specific, user-centric perceptual
processing time constants. Despite the ever-accelerating pace of
life, or at least the feeling of it, our reaction times remain constant
(Table 10-1),
regardless of type of application (online or offline), or medium
(laptop, desktop, or mobile device).
The preceding table helps explain the unofficial rule of thumb in
the web performance community: render pages, or at the very least
provide visual feedback, in under 250 milliseconds to keep the user
engaged!
For an application to feel instant, a perceptible response to user
input must be provided within hundreds of milliseconds. After a second
or more, the user’s flow and engagement with the initiated task is
broken, and after 10 seconds have passed, unless progress feedback is
provided, the task is frequently abandoned.
Now, add up the network latency of a DNS lookup, followed by a TCP
handshake, and another few roundtrips for a typical web page request,
and much, if not all, of our 100–1,000 millisecond latency budget can
be easily spent on just the networking overhead; see Figure 8-2.
No wonder so many users, especially when on a mobile or a wireless
network, are demanding faster web browsing performance!
Jakob Nielsen’s Usability Engineering and Steven Seow’s
Designing and Engineering Time are both excellent resources
that every developer and designer should read! Time is measured
objectively but perceived subjectively, and experiences can be
engineered to improve perceived performance.
No discussion on web performance is complete without a mention of
the resource waterfall. In fact, the resource waterfall is likely the
single most insightful network performance and diagnostics tool at our
disposal. Every browser provides some instrumentation to see the
resource waterfall, and there are great online tools, such as WebPageTest, which can render it
online for a wide variety of different browsers.
WebPageTest.org is an open-source project and a free web service
that provides a system for testing the performance of web pages from
multiple locations around the world: the browser runs within a
virtual machine and can be configured and scripted with a variety of
connection and browser-oriented settings. Following the test, the
results are then available through a web interface, which makes
WebPageTest an indispensable power tool in your web performance
toolkit.
To start, it is important to recognize that every HTTP request is
composed of a number of separate stages (Figure 10-3): DNS resolution, TCP
connection handshake, TLS negotiation (if required), dispatch of the
HTTP request, followed by content download. The visual display of these
individual stages may differ slightly within each browser, but to keep
things simple, we will use the WebPageTest version in this chapter.
Make sure to familiarize yourself with the meaning of each color in
your favorite browser.
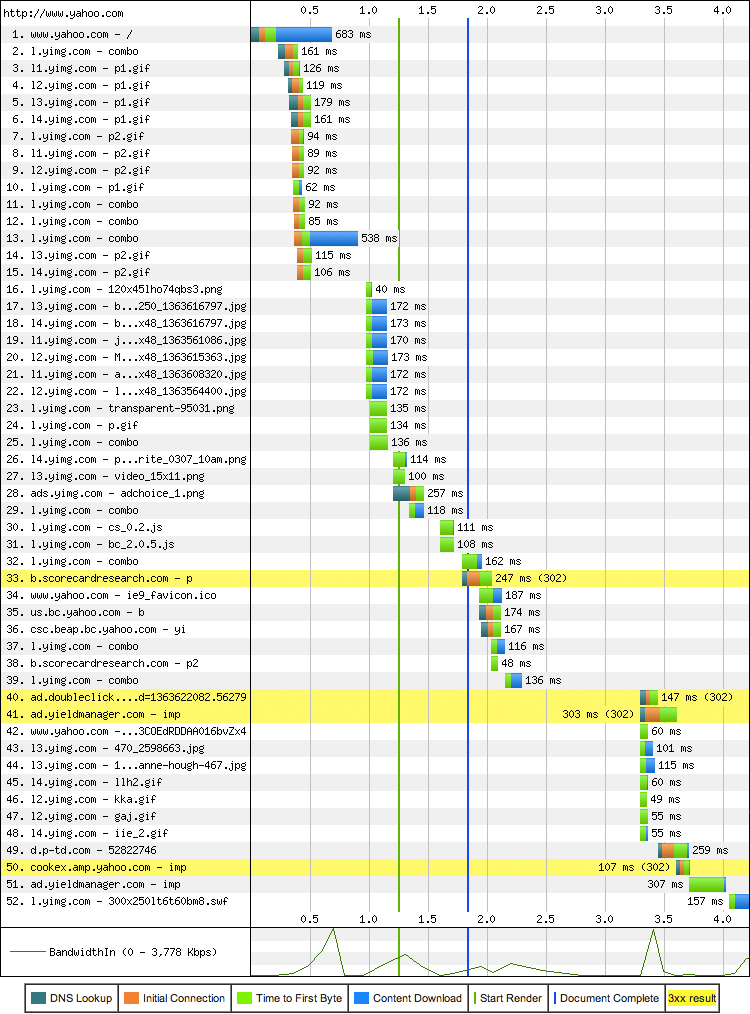
Close analysis of Figure 10-3 shows that the Yahoo!
homepage took 683 ms to download, and over 200 ms of that time was
spent waiting on the network, which amounts to 30% of total latency of
the request! However, the document request is only the beginning since,
as we know, a modern web application also needs a wide variety of
resources (Figure 10-4) to produce the final output.
To be exact, to load the Yahoo! homepage, the browser will require 52
resources, fetched from 30 different hosts, all adding up to 486 KB in
total.
The resource waterfall reveals a number of important insights about
the structure of the page and the browser processing pipeline. First
off, notice that while the content of the www.yahoo.com
document is being fetched, new HTTP requests are being dispatched: HTML
parsing is performed incrementally, allowing the browser to discover
required resources early and dispatch the necessary requests in
parallel. Hence, the scheduling of when the resource is fetched is in
large part determined by the structure of the markup. The browser may
reprioritize some requests, but the incremental discovery of each
resource in the document is what creates the distinct resource
"waterfall effect."
Second, notice that the "Start Render" (green vertical line) occurs
well before all the resources are fully loaded, allowing the user to
begin interacting with the page while the page is being built. In fact,
the "Document Complete" event (blue vertical line), also fires early
and well before the remaining assets are loaded. In other words, the
browser spinner has stopped spinning, the user is able to continue with
his task, but the Yahoo! homepage is progressively filling in
additional content, such as advertising and social widgets, in the
background.
The difference between the first render time, document complete, and
the time to finish fetching the last resource in the preceding example
is a great illustration of the necessary context when discussing
different web performance metrics. Which of those three metrics is the
right one to track? There is no one single answer; each application is
different! Yahoo! engineers have chosen to optimize the page to take
advantage of incremental loading to allow the user to begin consuming
the important content earlier, and in doing so they had to apply
application-specific knowledge about which content is critical and
which can be filled in later.
Different browsers implement different logic for when, and in
which order, the individual resource requests are dispatched. As a
result, the performance of the application will vary from browser to
browser.
Tip: WebPageTest allows you to select both the location and the
make and version of the browser when running the test!
The network waterfall is a power tool that can help reveal the
chosen optimizations, or lack thereof, for any page or application. The
previous process of analyzing and optimizing the resource waterfall is
often referred to as front-end performance analysis and
optimization. However, the name may be an unfortunate choice, as it
misleads many to believe that all performance bottlenecks are now on
the client. In reality, while JavaScript, CSS, and rendering pipelines
are critical and resource-intensive steps, the server response times
and network latency ("back-end performance") are no less critical for
optimizing the resource waterfall. After all, you can’t parse or
execute a resource that is blocked on the network!
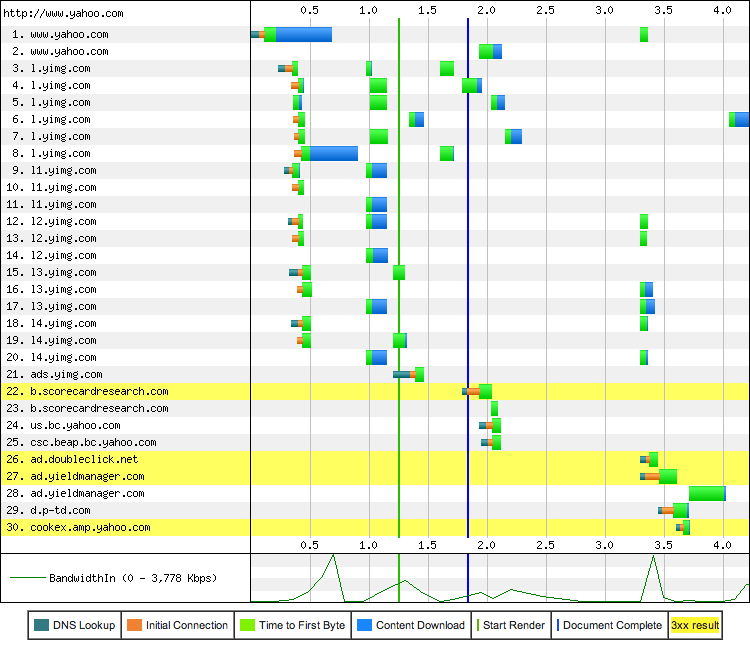
To illustrate this in action, we only have to switch from the
resource waterfall to the connection view
(Figure 10-5) provided by WebPageTest.
Unlike the resource waterfall, where each record represents an
individual HTTP request, the connection view shows the life of each TCP
connection—all 30 of them in this case—used to fetch the resources for
the Yahoo! homepage. Does anything stand out? Notice that the download
time, indicated in blue, is but a small fraction of the total latency
of each connection: there are 15 DNS lookups, 30 TCP handshakes, and a
lot of network latency (indicated in green) while waiting to receive
the first byte of each response.
Wondering why some requests are showing the green bar (time to
first byte) only? Many responses are very small, and consequently the
download time does not register on the diagram. In fact, for many
requests, response times are often dominated by the roundtrip latency
and server processing times.
Finally, we have saved the best for last. The real surprise
to many is found at the bottom of the connection view: examine the
bandwidth utilization chart in Figure 10-5. With the exception of a
few short data bursts, the utilization of the available connection is
very low—it appears that we are not limited by bandwidth of our
connection! Is this an anomaly, or worse, a browser bug? Unfortunately,
it is neither. Turns out, bandwidth is not the limiting performance
factor for most web applications. Instead, the bottleneck is the
network roundtrip latency between the client and the server.
§Speed,
Performance, and Human Perception
Delay
User perception
0–100 ms
Instant
100–300 ms
Small perceptible delay
300–1000 ms
Machine is working
1,000+ ms
Likely mental context switch
10,000+ ms
Task is abandoned
§Analyzing the
Resource Waterfall

§Performance Pillars: Computing, Rendering, Networking
The execution of a web program primarily involves three tasks: fetching resources, page layout and rendering, and JavaScript execution. The rendering and scripting steps follow a single-threaded, interleaved model of execution; it is not possible to perform concurrent modifications of the resulting Document Object Model (DOM). Hence, optimizing how the rendering and script execution runtimes work together, as we saw in DOM, CSSOM, and JavaScript, is of critical importance.
However, optimizing JavaScript execution and rendering pipelines also won’t do much good if the browser is blocked on the network, waiting for the resources to arrive. Fast and efficient delivery of network resources is the performance keystone of each and every application running in the browser.
But, one might ask, Internet speeds are getting faster by the day, so won’t this problem solve itself? Yes, our applications are growing larger, but if the global average speed is already at 3.1 Mbps (Bandwidth at the Network Edge) and growing, as evidenced by ubiquitous advertising by every ISP and mobile carrier, why bother, right? Unfortunately, as you might intuit, and as the Yahoo! example shows, if that were the case then you wouldn’t be reading this book. Let’s take a closer look.
For a detailed discussion of the trends and interplay of bandwidth and latency, refer back to the "Primer on Latency and Bandwidth" in Primer on Latency and Bandwidth.
§More Bandwidth Doesn’t Matter (Much)
Hold your horses; of course bandwidth matters! After all, every commercial by our local ISP and mobile carrier continues to remind us of its many benefits: faster downloads, uploads, and streaming, all at up to speeds of [insert latest number here] Mbps!
Access to higher bandwidth data rates is always good, especially for cases that involve bulk data transfers: video and audio streaming or any other type of large data transfer. However, when it comes to everyday web browsing, which requires fetching hundreds of relatively small resources from dozens of different hosts, roundtrip latency is the limiting factor:
-
Streaming an HD video from the Yahoo! homepage is bandwidth limited.
-
Loading and rendering the Yahoo! homepage is latency limited.
Depending on the quality and the encoding of the video you are trying to stream, you may need anywhere from a few hundred Kbps to several Mbps in bandwidth capacity—e.g., 3+ Mbps for an HD 1080p video stream. This data rate is now within reach for many users, which is evidenced by the growing popularity of streaming video services such as Netflix. Why, then, would downloading a much, much smaller web application be such a challenge for a connection capable of streaming an HD movie?
§Latency as a Performance Bottleneck
We have already covered all the necessary topics in preceding
chapters to make a good qualitative theory as to why latency may be the
limiting factor for everyday web browsing. However, a picture is worth
a thousand words, so let’s examine the results of a quantitative study
performed by Mike Belshe (Figure 10-6), one of the creators of
the SPDY protocol, on the impact of varying bandwidth vs. latency on
the page load times of some of the most popular destinations on the
Web.

This study by Mike Belshe served as a launching point for the development of the SPDY protocol at Google, which later became the foundation of the HTTP/2 protocol.
In the first test, the connection latency is held fixed, and the connection bandwidth is incrementally increased from 1 Mbps up to 10 Mbps. Notice that at first, upgrading the connection from 1 to 2 Mbps nearly halves the page loading time—exactly the result we want to see. However, following that, each incremental improvement in bandwidth yields diminishing returns. By the time the available bandwidth exceeds 5 Mbps, we are looking at single-digit percent improvements, and upgrading from 5 Mbps to 10 Mbps results in a mere 5% improvement in page loading times!
Akamai’s broadband speed report (Bandwidth at the Network Edge) shows that an average consumer in the United States is already accessing the Web with 5 Mbps+ of available bandwidth—a number that many other countries are quickly approaching or have surpassed already. Ergo, we are led to conclude that an average consumer in the United States would not benefit much from upgrading the available bandwidth of her connection if she is interested in improving her web browsing speeds. She may be able to stream or upload larger media files more quickly, but the pages containing those files will not load noticeably faster: bandwidth doesn’t matter, much.
However, the latency experiment tells an entirely different story: for every 20 millisecond improvement in latency, we have a linear improvement in page loading times! Perhaps it is latency we should be optimizing for when deciding on an ISP, and not just bandwidth?
To speed up the Internet at large, we should look for more ways to bring down RTT. What if we could reduce cross-atlantic RTTs from 150 ms to 100 ms? This would have a larger effect on the speed of the internet than increasing a user’s bandwidth from 3.9 Mbps to 10 Mbps or even 1 Gbps.
Another approach to reducing page load times would be to reduce the number of round trips required per page load. Today, web pages require a certain amount of back and forth between the client and server. The number of round trips is largely due to the handshakes to start communicating between client and server (e.g., DNS, TCP, HTTP), and also round trips induced by the communication protocols (e.g., TCP slow start). If we can improve protocols to transfer this data with fewer round trips, we should also be able to improve page load times. This is one of the goals of SPDY.
Mike Belshe, More Bandwidth Doesn't Matter (Much)
The previous results are a surprise to many, but they really should not be, as they are a direct consequence of the performance characteristics of the underlying protocols: TCP handshakes, flow and congestion control, and head-of-line blocking due to packet loss. Most of the HTTP data flows consist of small, bursty data transfers, whereas TCP is optimized for long-lived connections and bulk data transfers. Network roundtrip time is the limiting factor in TCP throughput and performance in most cases; see Optimizing for TCP. Consequently, latency is also the performance bottleneck for HTTP and most web applications delivered over it.
If latency is the limiting performance factor for most wired connections then, as you might intuit, it is an even more important performance bottleneck for wireless clients: wireless latencies are significantly higher, making networking optimization a critical priority for the mobile web.
§Synthetic and Real-User Performance Measurement
If we can measure it, we can improve it. The question is, are we measuring the right criteria, and is the process sound? As we noted earlier, measuring the performance of a modern web application is a nontrivial challenge: there is no one single metric that holds true for every application, which means that we must carefully define custom metrics in each case. Then, once the criteria are established, we must gather the performance data, which should be done through a combination of synthetic and real-user performance measurement.
Broadly speaking, synthetic testing refers to any process with a controlled measurement environment: a local build process running through a performance suite, load testing against staging infrastructure, or a set of geo-distributed monitoring servers that periodically perform a set of scripted actions and log the outcomes. Each and every one of these tests may test a different piece of the infrastructure (e.g., application server throughput, database performance, DNS timing, and so on), and serves as a stable baseline to help detect regressions or narrow in on a specific component of the system.
When configured well, synthetic testing provides a controlled and reproducible performance testing environment, which makes it a great fit for identifying and fixing performance regressions before they reach the user. Tip: identify your key performance metrics and set a "budget" for each one as part of your synthetic testing. If the budget is exceeded, raise an alarm!
However, synthetic testing is not sufficient to identify all performance bottlenecks. Specifically, the problem is that the gathered measurements are not representative of the wide diversity of the real-world factors that will determine the final user experience with the application. Some contributing factors to this gap include the following:
-
Scenario and page selection: replicating real user navigation patterns is hard.
-
Browser cache: performance may vary widely based on the state of the user’s cache.
-
Intermediaries: performance may vary based on intermediate proxies and caches.
-
Diversity of hardware: wide range of CPU, GPU, and memory performance.
-
Diversity of browsers: wide range of browser versions, both old and new.
-
Connectivity: continuously changing bandwidth and latency of real connections.
The combination of these and similar factors means that in addition to
synthetic testing, we must augment our performance strategy with
real-user measurement (RUM) to capture actual performance of our
application as experienced by the user. The good news is the W3C Web
Performance Working Group has made this part of our data-gathering
process a simple one by introducing the Navigation Timing API
(Figure 10-7),
which is now supported across many of the modern desktop and mobile
browsers.

As of early 2013, Navigation Timing is supported by IE9+, Chrome 6+, and Firefox 7+ across desktop and mobile platforms. The notable omissions are the Safari and Opera browsers. For the latest status, see caniuse.com/nav-timing.
The real benefit of Navigation Timing is that it exposes a lot of
previously inaccessible data, such as DNS and TCP connect times, with
high precision (microsecond timestamps), via a standardized
performance.timing object in each browser. Hence, the data
gathering process is very simple: load the page, grab the timing object
from the user’s browser, and beacon it back to your analytics servers! By
capturing this data, we can observe real-world performance of our
applications as seen by real users, on real hardware, and across a wide
variety of different networks.
Finally, in addition to Navigation Timing, the W3C Performance Group also standardized two other APIs: User Timing and Resource Timing. Whereas Navigation Timing provides performance timers for root documents only, Resource Timing provides similar performance data for each resource on the page, allowing us to gather the full performance profile of the page. Similarly, User Timing provides a simple JavaScript API to mark and measure application-specific performance metrics with the help of the same high-resolution timers:
function init() {
  performance.mark("startTask1");
  applicationCode1();
  performance.mark("endTask1");

  logPerformance();
}

function logPerformance() {
  var perfEntries = performance.getEntriesByType("mark");
  for (var i = 0; i < perfEntries.length; i++) {
    console.log("Name: " + perfEntries[i].name +
                " Entry Type: " + perfEntries[i].entryType +
                " Start Time: " + perfEntries[i].startTime +
                " Duration: "   + perfEntries[i].duration  + "\n");
  }
  console.log(performance.timing);
}
The combination of Navigation, Resource, and User timing APIs provides all the necessary tools to instrument and conduct real-user performance measurement for every web application; there is no longer any excuse not to do it right. We optimize what we measure, and RUM and synthetic testing are complementary approaches to help you identify regressions and real-world bottlenecks in the performance and the user experience of your applications.
Custom and application-specific metrics are the key to establishing a sound performance strategy. There is no generic way to measure or define the quality of user experience. Instead, we must define and instrument specific milestones and events in each application, a process that requires collaboration between all the stakeholders in the project: business owners, designers, and developers.
§Browser Optimization
We would be remiss if we didn’t mention that a modern browser is much more than a simple network socket manager. Performance is one of the primary competitive features for each browser vendor, and given that the networking performance is such a critical criteria, it should not surprise you that the browsers are getting smarter every day: pre-resolving likely DNS lookups, pre-connecting to likely destinations, pre-fetching and prioritizing critical resources on the page, and more.
The exact list of performed optimizations will differ by browser vendor, but at their core the optimizations can be grouped into two broad classes:
- Document-aware optimization
-
The networking stack is integrated with the document, CSS, and JavaScript parsing pipelines to help identify and prioritize critical network assets, dispatch them early, and get the page to an interactive state as soon as possible. This is often done via resource priority assignments, lookahead parsing, and similar techniques.
- Speculative optimization
-
The browser may learn user navigation patterns over time and perform speculative optimizations in an attempt to predict the likely user actions by pre-resolving DNS names, pre-connecting to likely hostnames, and so on.
The good news is all of these optimizations are done automatically on our behalf and often lead to hundreds of milliseconds of saved network latency. Having said that, it is important to understand how and why these optimizations work under the hood, because we can assist the browser and help it do an even better job at accelerating our applications. There are four techniques employed by most browsers:
- Resource pre-fetching and prioritization
-
Document, CSS, and JavaScript parsers may communicate extra information to the network stack to indicate the relative priority of each resource: blocking resources required for first rendering are given high priority, while low-priority requests may be temporarily held back in a queue.
- DNS pre-resolve
-
Likely hostnames are pre-resolved ahead of time to avoid DNS latency on a future HTTP request. A pre-resolve may be triggered through learned navigation history, a user action such as hovering over a link, or other signals on the page.
- TCP pre-connect
-
Following a DNS resolution, the browser may speculatively open the TCP connection in an anticipation of an HTTP request. If it guesses right, it can eliminate another full roundtrip (TCP handshake) of network latency.
- Page pre-rendering
-
Some browsers allow you to hint the likely next destination and can pre-render the entire page in a hidden tab, such that it can be instantly swapped in when the user initiates the navigation.
For a deep dive into how these and other networking optimizations are implemented in Google Chrome, see High Performance Networking in Google Chrome.
From the outside, a modern browser network stack presents itself as simple resource-fetching mechanism, but from the inside, it is an elaborate and a fascinating case study for how to optimize for web performance. So how can we assist the browser in this quest? To start, pay close attention to the structure and the delivery of each page:
-
Critical resources such as CSS and JavaScript should be discoverable as early as possible in the document.
-
CSS should be delivered as early as possible to unblock rendering and JavaScript execution.
-
Noncritical JavaScript should be deferred to avoid blocking DOM and CSSOM construction.
-
The HTML document is parsed incrementally by the parser; hence the document should be periodically flushed for best performance.
Further, aside from optimizing the structure of the page, we can also embed additional hints into the document itself to tip off the browser about additional optimizations it can perform on our behalf:
<link rel="dns-prefetch" href="//hostname_to_resolve.com">
<link rel="subresource"  href="/javascript/myapp.js">
<link rel="prefetch"     href="/images/big.jpeg">
<link rel="prerender"    href="//example.org/next_page.html">
Each of these is a hint for a speculative optimization. The browser
does not guarantee that it will act on it, but it may use the hint to
optimize its loading strategy. Unfortunately, not all browsers support
all hints (Table 10-2), but if they don’t, then the
hint is treated as a no-op and is harmless; make use of each of the
techniques just shown where possible.
Browser
dns-prefetch
subresource
prefetch
prerender
Firefox
3.5+
n/a
3.5+
n/a
Chrome
1.0+
1.0+
1.0+
13+
Safari
5.01+
n/a
n/a
n/a
IE
9+ (prefetch)
n/a
10+
11+
Internet Explorer 9 supports DNS pre-fetching, but calls it prefetch. In Internet Explorer 10+, dns-prefetch and prefetch are equivalent, resulting in a DNS pre-fetch in both cases.
To most users and even web developers, the DNS, TCP, and SSL delays are entirely transparent and are negotiated at network layers to which few of us descend. And yet each of these steps is critical to the overall user experience, since each extra network roundtrip can add tens or hundreds of milliseconds of network latency. By helping the browser anticipate these roundtrips, we can remove these bottlenecks and deliver much faster and better web applications.