§Speed Is a Feature
The emergence and the fast growth of the web performance optimization (WPO) industry within the past few years is a telltale sign of the growing importance and demand for speed and faster user experiences by the users. And this is not simply a psychological need for speed in our ever accelerating and connected world, but a requirement driven by empirical results, as measured with respect to the bottom-line performance of the many online businesses:
-
Faster sites lead to better user engagement.
-
Faster sites lead to better user retention.
-
Faster sites lead to higher conversions.
Simply put, speed is a feature. And to deliver it, we need to understand the many factors and fundamental limitations that are at play. In this chapter, we will focus on the two critical components that dictate the performance of all network traffic: latency and bandwidth (Figure 1-1).
- Latency
-
The time from the source sending a packet to the destination receiving it
- Bandwidth
-
Maximum throughput of a logical or physical communication path

Armed with a better understanding of how bandwidth and latency work together, we will then have the tools to dive deeper into the internals and performance characteristics of TCP, UDP, and all application protocols above them.
§The Many Components of Latency
Latency is the time it takes for a message, or a packet, to travel from its point of origin to the point of destination. That is a simple and useful definition, but it often hides a lot of useful information — every system contains multiple sources, or components, contributing to the overall time it takes for a message to be delivered, and it is important to understand what these components are and what dictates their performance.
Let’s take a closer look at some common contributing components for a typical router on the Internet, which is responsible for relaying a message between the client and the server:
- Propagation delay
-
Amount of time required for a message to travel from the sender to receiver, which is a function of distance over speed with which the signal propagates.
- Transmission delay
-
Amount of time required to push all the packet’s bits into the link, which is a function of the packet’s length and data rate of the link.
- Processing delay
-
Amount of time required to process the packet header, check for bit-level errors, and determine the packet’s destination.
- Queuing delay
-
Amount of time the packet is waiting in the queue until it can be processed.
The total latency between the client and the server is the sum of all the delays just listed. Propagation time is dictated by the distance and the medium through which the signal travels — as we will see, the propagation speed is usually within a small constant factor of the speed of light. On the other hand, transmission delay is dictated by the available data rate of the transmitting link and has nothing to do with the distance between the client and the server. As an example, let’s assume we want to transmit a 10 Mb file over two links: 1 Mbps and 100 Mbps. It will take 10 seconds to put the entire file "on the wire" over the 1 Mbps link and only 0.1 seconds over the 100 Mbps link.
Network data rates are typically measured in bits per second (bps), whereas data rates for non-network equipment are typically shown in bytes per second (Bps). This is a common source of confusion, pay close attention to the units.
For example, to put a 10 megabyte (MB) file "on the wire" over a 1Mbps link, we will need 80 seconds. 10MB is equal to 80Mb because there are 8 bits for every byte!
Next, once the packet arrives at the router, the router must examine the packet header to determine the outgoing route and may run other checks on the data — this takes time as well. Much of this logic is now often done in hardware, so the delays are very small, but they do exist. And, finally, if the packets are arriving at a faster rate than the router is capable of processing, then the packets are queued inside an incoming buffer. The time data spends queued inside the buffer is, not surprisingly, known as queuing delay.
Each packet traveling over the network will incur many instances of each of these delays. The farther the distance between the source and destination, the more time it will take to propagate. The more intermediate routers we encounter along the way, the higher the processing and transmission delays for each packet. Finally, the higher the load of traffic along the path, the higher the likelihood of our packet being queued and delayed inside one or more buffers.
§Speed of Light and Propagation Latency
As Einstein outlined in his theory of special relativity, the speed of light is the maximum speed at which all energy, matter, and information can travel. This observation places a hard limit, and a governor, on the propagation time of any network packet.
The good news is the speed of light is high: 299,792,458 meters per second, or 186,282 miles per second. However, and there is always a however, that is the speed of light in a vacuum. Instead, our packets travel through a medium such as a copper wire or a fiber-optic cable, which will slow down the signal (Table 1-1). This ratio of the speed of light and the speed with which the packet travels in a material is known as the refractive index of the material. The larger the value, the slower light travels in that medium.
The typical refractive index value of an optical fiber, through which
most of our packets travel for long-distance hops, can vary between 1.4
to 1.6 — slowly but surely we are making improvements in the quality of
the materials and are able to lower the refractive index. But to keep it
simple, the rule of thumb is to assume that the speed of light in fiber
is around 200,000,000 meters per second, which corresponds to a
refractive index of ~1.5. The remarkable part about this is that we are
already within a small constant factor of the maximum speed! An amazing
engineering achievement in its own right.
Route
Distance
Time, light in vacuum
Time, light in fiber
Round-trip time (RTT) in fiber
New York to San Francisco
4,148 km
14 ms
21 ms
42 ms
New York to London
5,585 km
19 ms
28 ms
56 ms
New York to Sydney
15,993 km
53 ms
80 ms
160 ms
Equatorial circumference
40,075 km
133.7 ms
200 ms
200 ms
The speed of light is fast, but it nonetheless takes 160 milliseconds to make the round-trip (RTT) from New York to Sydney. In fact, the numbers in Table 1-1 are also unrealistically optimistic in that they assume that the packet travels over a fiber-optic cable along the great-circle path (the shortest distance between two points on the globe) between the cities. In practice, that is rarely the case, and the packet would take a much longer route between New York and Sydney. Each hop along this route will introduce additional routing, processing, queuing, and transmission delays. As a result, the actual RTT between New York and Sydney, over our existing networks, works out to be in the 200–300 millisecond range. All things considered, that still seems pretty fast, right?
We are not accustomed to measuring our everyday encounters in milliseconds, but studies have shown that most of us will reliably report perceptible "lag" once a delay of over 100–200 milliseconds is introduced into the system. Once the 300 millisecond delay threshold is exceeded, the interaction is often reported as "sluggish," and at the 1,000 milliseconds (1 second) barrier, many users have already performed a mental context switch while waiting for the response — see Speed, Performance, and Human Perception.
The point is simple, to deliver the best experience and to keep our users engaged in the task at hand, we need our applications to respond within hundreds of milliseconds. That doesn’t leave us, and especially the network, with much room for error. To succeed, network latency has to be carefully managed and be an explicit design criteria at all stages of development.
Content delivery network (CDN) services provide many benefits, but chief among them is the simple observation that distributing the content around the globe, and serving that content from a nearby location to the client, enables us to significantly reduce the propagation time of all the data packets.
We may not be able to make the packets travel faster, but we can reduce the distance by strategically positioning our servers closer to the users! Leveraging a CDN to serve your data can offer significant performance benefits.
§Last-Mile Latency
Ironically, it is often the last few miles, not the crossing of oceans or continents, where significant latency is introduced: the infamous last-mile problem. To connect your home or office to the Internet, your local ISP needs to route the cables throughout the neighborhood, aggregate the signal, and forward it to a local routing node. In practice, depending on the type of connectivity, routing methodology, and deployed technology, these first few hops alone can take tens of milliseconds.
According to the annual "Measuring Broadband America" reports conducted by the Federal Communications Commission (FCC), the last-mile latencies for terrestrial-based broadband (DSL, cable, fiber) within the United States have remained relatively stable over time: fiber has best average performance (10-20 ms), followed by cable (15-40 ms), and DSL (30-65 ms).
In practice this translates into 10-65 ms of latency just to the
closest measuring node within the ISP’s core network, before the packet
is even routed to its destination! The FCC report is focused on the
United States, but last-mile latency is a challenge for all Internet
providers, regardless of geography. For the curious, a simple
traceroute can often tell you volumes about the topology and
performance of your Internet provider.
  $> traceroute google.com
  traceroute to google.com (74.125.224.102), 64 hops max, 52 byte packets
   1  10.1.10.1 (10.1.10.1)  7.120 ms  8.925 ms  1.199 ms
   2  96.157.100.1 (96.157.100.1)  20.894 ms  32.138 ms  28.928 ms
   3  x.santaclara.xxxx.com (68.85.191.29)  9.953 ms  11.359 ms  9.686 ms
   4  x.oakland.xxx.com (68.86.143.98)  24.013 ms 21.423 ms 19.594 ms
   5  68.86.91.205 (68.86.91.205)  16.578 ms  71.938 ms  36.496 ms
   6  x.sanjose.ca.xxx.com (68.86.85.78)  17.135 ms  17.978 ms  22.870 ms
   7  x.529bryant.xxx.com (68.86.87.142)  25.568 ms  22.865 ms  23.392 ms
   8  66.208.228.226 (66.208.228.226)  40.582 ms  16.058 ms  15.629 ms
   9  72.14.232.136 (72.14.232.136)  20.149 ms  20.210 ms  18.020 ms
  10  64.233.174.109 (64.233.174.109)  63.946 ms  18.995 ms  18.150 ms
  11  x.1e100.net (74.125.224.102)  18.467 ms  17.839 ms  17.958 ms
In the previous example, the packet started in the city of Sunnyvale, bounced to Santa Clara, then Oakland, returned to San Jose, got routed to the "529 Bryant" datacenter, at which point it was routed toward Google and arrived at its destination on the 11th hop. This entire process took, on average, 18 milliseconds. Not bad, all things considered, but in the same time the packet could have traveled across most of the continental USA!
The last-mile latencies can vary wildly between ISP’s due to the deployed technology, topology of the network, and even the time of day. As an end user, and if you are looking to improve your web browsing speeds, make sure to measure and compare the last-mile latencies of the various providers available in your area.
Latency, not bandwidth, is the performance bottleneck for most websites! To understand why, we need to understand the mechanics of TCP and HTTP protocols — subjects we’ll be covering in subsequent chapters. However, if you are curious, feel free to skip ahead to More Bandwidth Doesn’t Matter (Much).
§Bandwidth in Core Networks
An optical fiber acts as a simple "light pipe," slightly thicker than a human hair, designed to transmit light between the two ends of the cable. Metal wires are also used but are subject to higher signal loss, electromagnetic interference, and higher lifetime maintenance costs. Chances are, your packets will travel over both types of cable, but for any long-distance hops, they will be transmitted over a fiber-optic link.
Optical fibers have a distinct advantage when it comes to bandwidth because each fiber can carry many different wavelengths (channels) of light through a process known as wavelength-division multiplexing (WDM). Hence, the total bandwidth of a fiber link is the multiple of per-channel data rate and the number of multiplexed channels.
As of early 2010, researchers have been able to multiplex over 400 wavelengths with the peak capacity of 171 Gbit/s per channel, which translates to over 70 Tbit/s of total bandwidth for a single fiber link! We would need thousands of copper wire (electrical) links to match this throughput. Not surprisingly, most long-distance hops, such as subsea data transmission between continents, is now done over fiber-optic links. Each cable carries several strands of fiber (four strands is a common number), which translates into bandwidth capacity in hundreds of terabits per second for each cable.
§Bandwidth at the Network Edge
The backbones, or the fiber links, that form the core data paths of the Internet are capable of moving hundreds of terabits per second. However, the available capacity at the edges of the network is much, much less, and varies wildly based on deployed technology: dial-up, DSL, cable, a host of wireless technologies, fiber-to-the-home, and even the performance of the local router. The available bandwidth to the user is a function of the lowest capacity link between the client and the destination server (Figure 1-1).
Akamai Technologies operates a global CDN, with servers positioned
around the globe, and provides free quarterly reports at Akamai’s website on average broadband speeds,
as seen by their servers. Table 1-2 captures the macro trends as
of late 2015.
Rank
Country
Average Mbps
Year-over-year change
-
Global
5.1
14%
1
South Korea
20.5
-19%
2
Sweden
17.4
23%
3
Norway
16.4
44%
4
Switzerland
16.2
12%
5
Hong Kong
15.8
-2.7%
…
21
United States
12.6
9.4%
The preceding data excludes traffic from mobile carriers, a topic we will come back to later to examine in closer detail. For now, it should suffice to say that mobile speeds are highly variable and generally slower. However, even with that in mind, the average global broadband bandwidth in late 2015 was just 5.1 Mbps! South Korea led the world with a 20.5 Mbps average throughput, and United States came in 21st place with 12.6 Mbps.
As a reference point, streaming an HD video can require anywhere from 2 to 10 Mbps depending on resolution and the codec. So an average user within the United States can stream a high-resolution video at the network edge, but doing so would also consume much of their link capacity — not a very promising story for a household with multiple users.
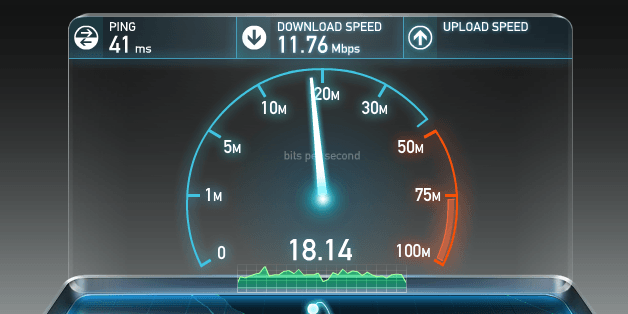
Figuring out where the bandwidth bottleneck is for any given user is
often a nontrivial but important exercise. Once again, for the curious,
there are a number of online services, such as speedtest.net operated by Ookla (Figure 1-2), which provide upstream and
downstream tests against a nearby server — we will see why picking a
local server is important in our discussion on TCP. Running a test on one
of these services is a good way to check that your connection meets the
advertised speeds of your local ISP.
However, while a high-bandwidth link to your ISP is desirable, it is also not a guarantee of end-to-end performance; just because a bandwidth test promises high data rates does not mean that you can or should expect same performance from other remote servers. The network could be congested at any intermediate node due to high demand, hardware failures, a concentrated network attack, or a host of other reasons. High variability of throughput and latency performance is an inherent property of our data networks — predicting, managing, and adapting to the continuously changing "network weather" is a complex task.
§Delivering Higher Bandwidth and Lower Latencies
Our demand for higher bandwidth is growing fast, in large part due to the rising popularity of streaming video, which is now responsible for well over half of all Internet traffic. The good news is, while it may not be cheap, there are multiple strategies available for us to grow the available capacity: we can add more fibers into our fiber-optic links, we can deploy more links across the congested routes, or we can improve the WDM techniques to transfer more data through existing links.
TeleGeography, a telecommunications market research and consulting firm, estimates that as of 2011, we are using, on average, just 20% of the available capacity of the deployed subsea fiber links. Even more importantly, between 2007 and 2011, more than half of all the added capacity of the trans-Pacific cables was due to WDM upgrades: same fiber links, better technology on both ends to multiplex the data. Of course, we cannot expect these advances to go on indefinitely, as every medium reaches a point of diminishing returns. Nonetheless, as long as economics of the enterprise permit, there is no fundamental reason why bandwidth throughput cannot be increased over time — if all else fails, we can add more fiber links.
Improving latency, on the other hand, is a very different story. The quality of the fiber links could be improved to get us a little closer to the speed of light: better materials with lower refractive index and faster routers along the way. However, given that our current speeds are already within ~2/3 of the speed of light, the most we can expect from this strategy is just a modest 30% improvement. Unfortunately, there is simply no way around the laws of physics: the speed of light places a hard limit on the minimum latency.
Alternatively, since we can’t make light travel faster, we can make the distance shorter — the shortest distance between any two points on the globe is defined by the great-circle path between them. However, laying new cables is also not always possible due to the constraints imposed by the physical terrain, social and political reasons, and of course, the associated costs.
As a result, to improve performance of our applications, we need to architect and optimize our protocols and networking code with explicit awareness of the limitations of available bandwidth and the speed of light: we need to reduce round trips, move the data closer to the client, and build applications that can hide the latency through caching, pre-fetching, and a variety of similar techniques, as explained in subsequent chapters.